Watch it, schedule it, back it up
Everything you need to run masqueradarr day-to-day: live streaming telemetry, historical QoE analytics, system stats, categorized logs, the automatic scheduler, and full-system backup / restore.
Who's watching what, right now
A real-time monitor of everything currently being watched. Each session shows the channel, its playlist/source, the viewer, current bitrate, uptime, and a health indicator. It's live telemetry pushed over a WebSocket — no refresh button, held in memory, always the present moment.
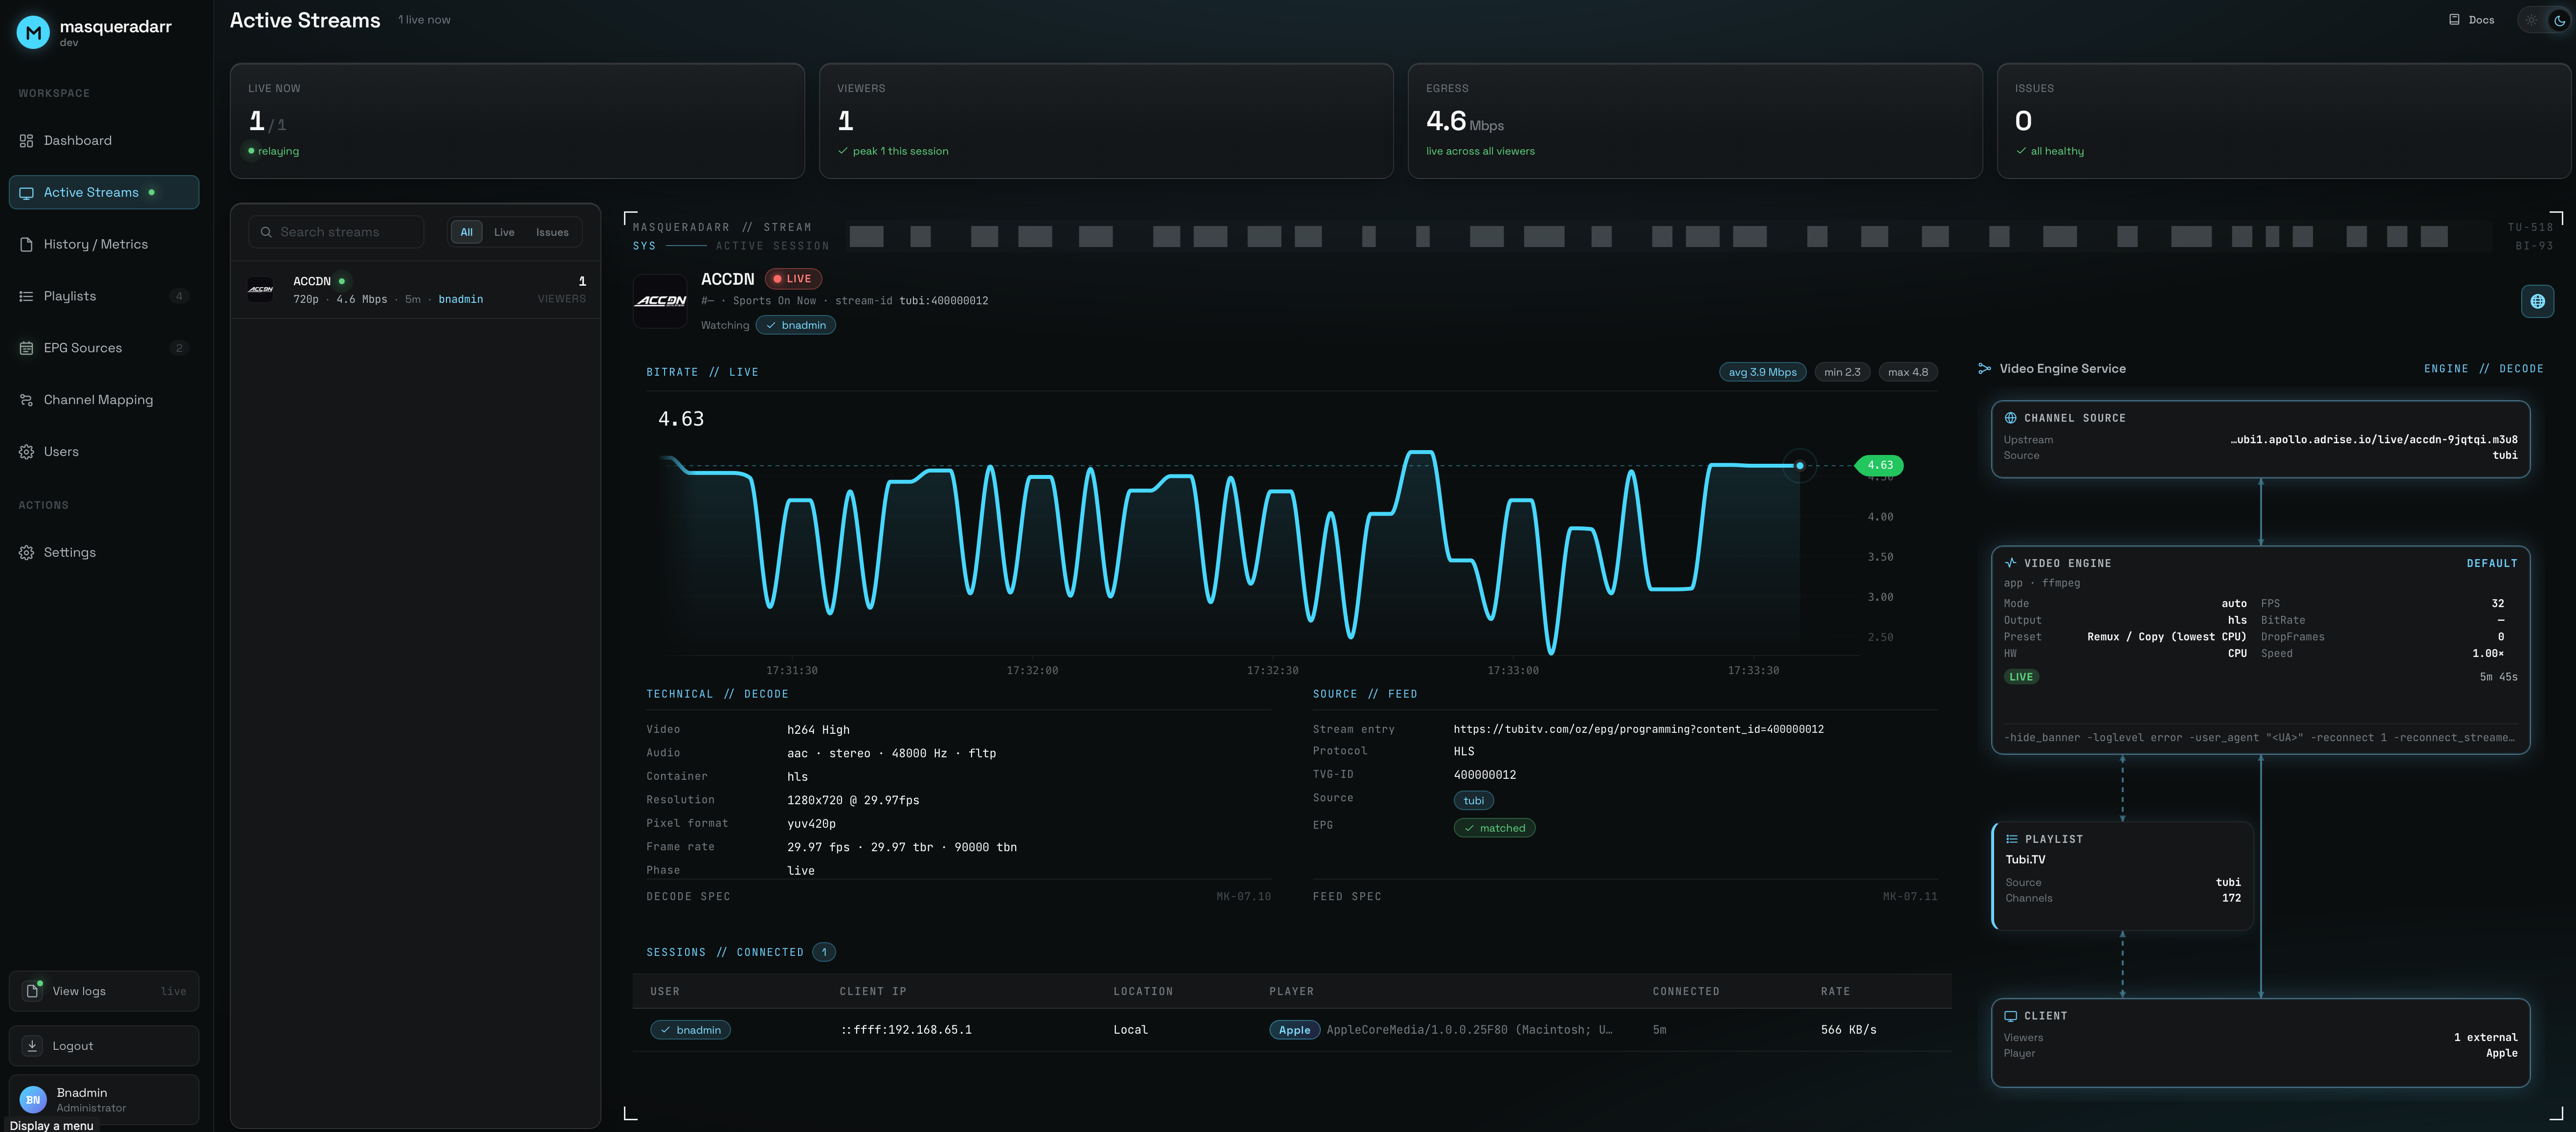
A healthy session shows a steady bitrate and climbing uptime. A session flagged failing is one the server couldn't keep fed — worth investigating, and it drives the live pulse dot next to Active Streams in the sidebar. An empty screen is normal when nobody is watching. To investigate: note the channel + source, open View logs filtered to that source, and cross-check the channel on its Playlist detail.
Opening a session gives you four tabs that follow the bytes in order — SOURCE // FEED (which provider answered, in what wire format, and what was requested versus what is being served), INGEST // RING (the shared ingest and what it is holding), PLAYLIST // MANIFEST (the published window, its discontinuities, any ad break) and OUTPUT // FEED (what viewers actually received, and the amplification between the two). Arrow keys, Home and End move between them.
Empty values are written to be read, not guessed at: “passthrough — no local ring”, “no reading yet — needs two distinct ingest frames”, “the rewrite path is serving this channel, not the ring”. A missing number tells you which stage isn't running.
A stream running under local origin grows three extra rows in its detail card, next to the existing Delivery row: Ingest (<status> · N viewer(s) sharing, tinted amber when the status isn't ok), Ring (N seg · N.N MiB against that channel's own cap, plus · N evicted once eviction starts) and Upstream pulled (N seg · N.N MiB). Their absence is itself the signal that a stream is on the ordinary rewriting path. Do not read Upstream pulled against the bitrate chart above it — one is a single shared ingest, the other is egress across every viewer, so with N viewers they diverge by roughly N×. That divergence is the feature working.
When a channel's own upstream failed and one of its failover backups is carrying the stream, the session is badged failover → <child>, and its detail panel names the backup's position in the line. The parent may simultaneously show as probe-dead on its playlist — that is coherent, not a contradiction: the probe tests each channel on its own, while the session is being served by a stand-in.
The quality-of-experience record
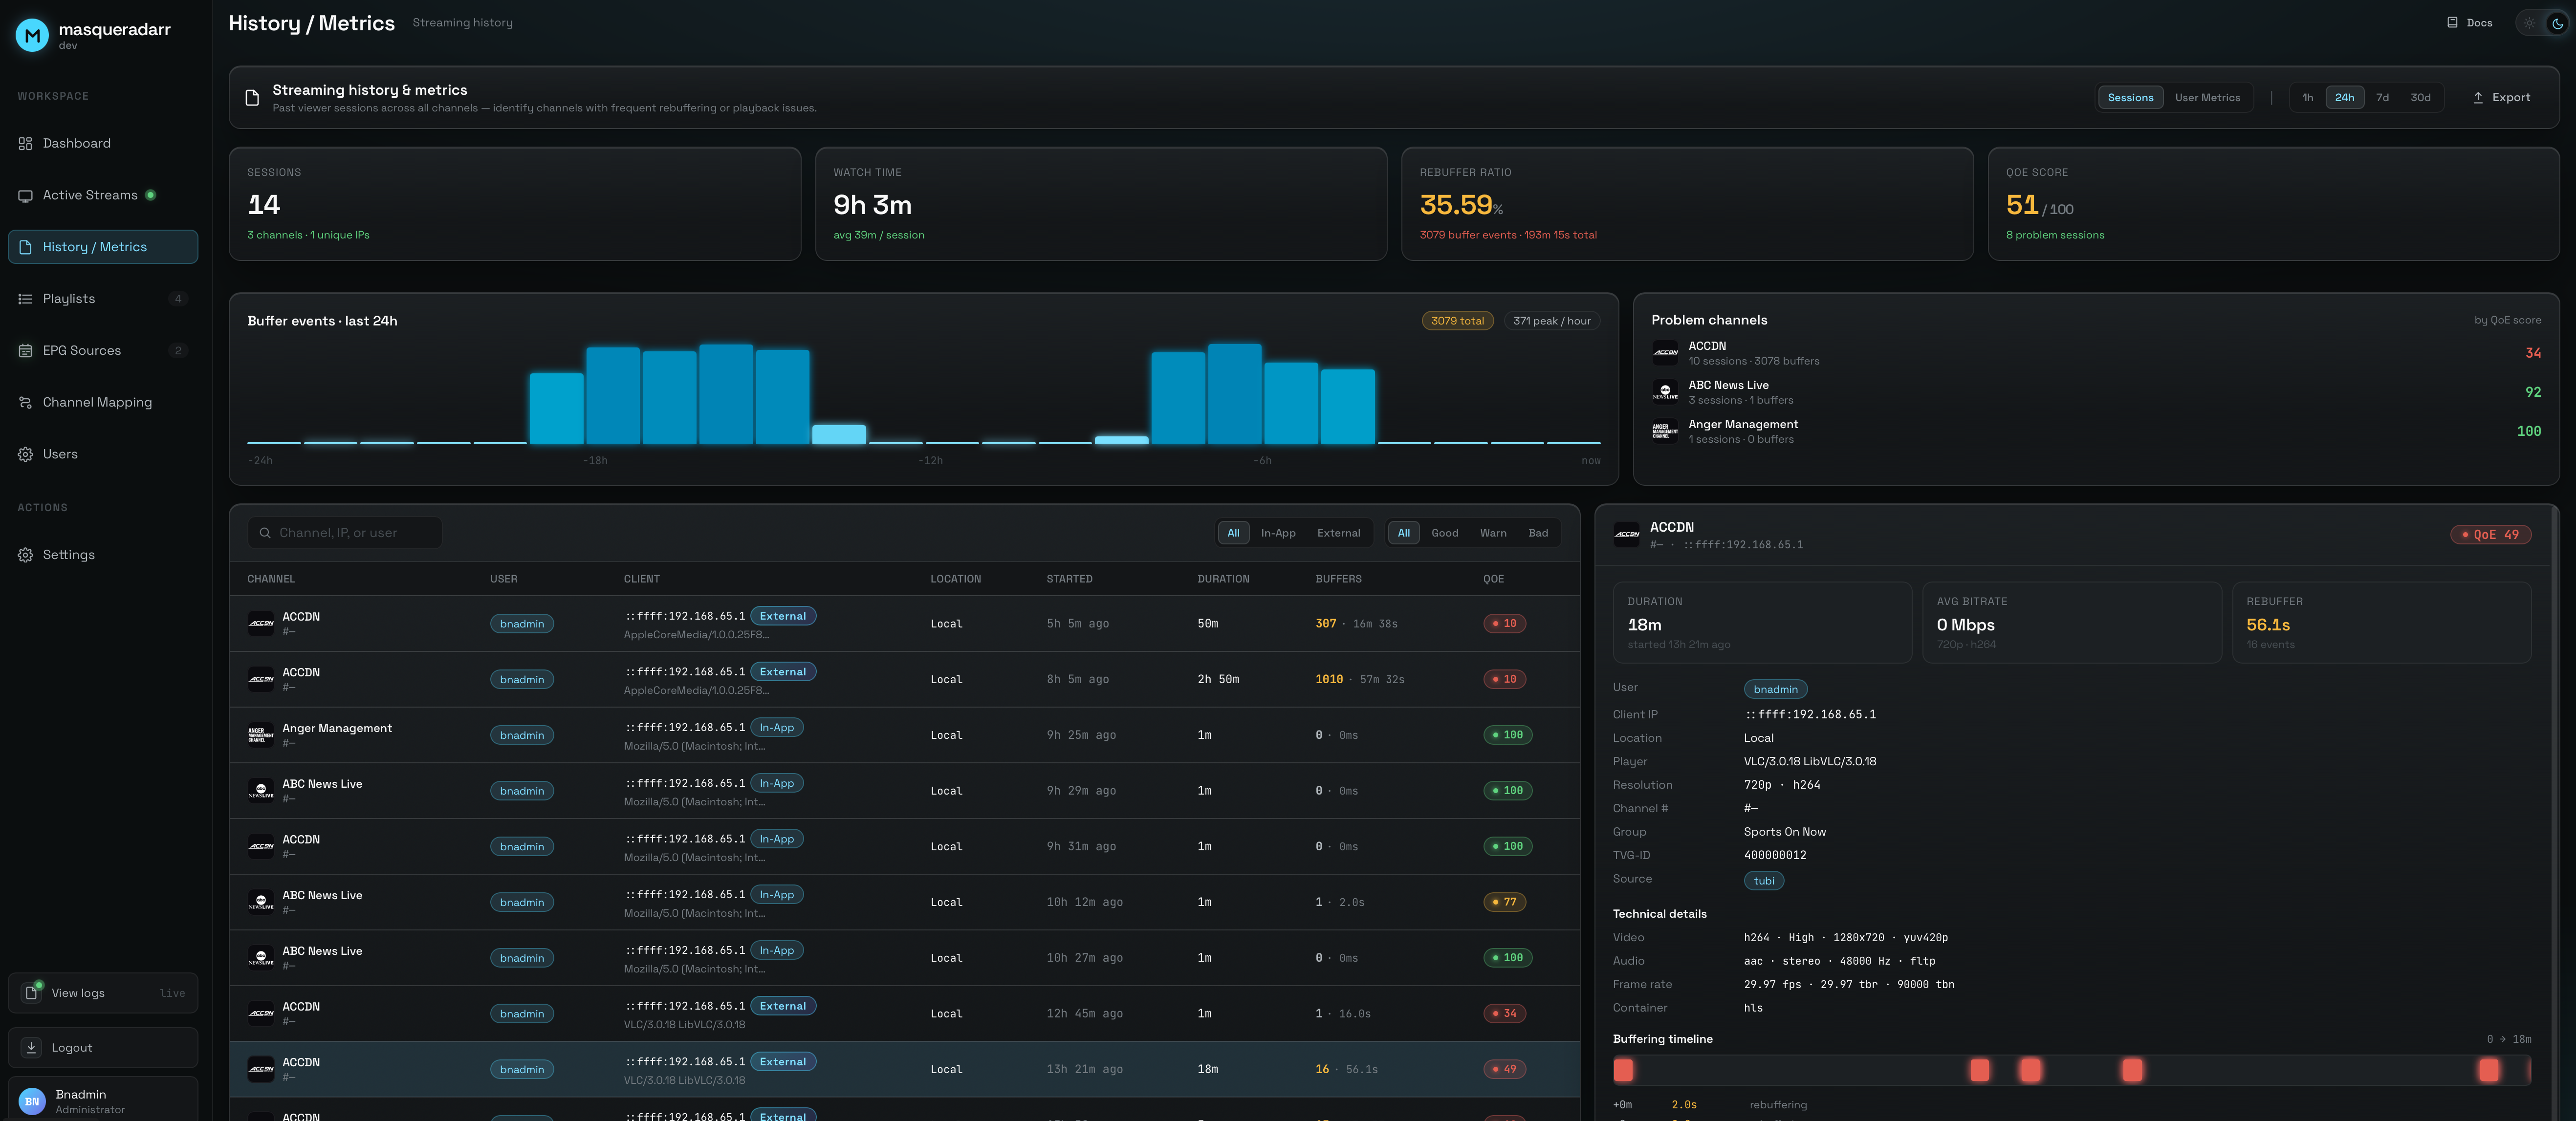
Where Active Streams shows the present, History / Metrics shows the past: every completed viewing session, from persisted view-session history. It grows over time; a fresh install is empty.
Headline totals
Sessions, viewers, data served, and similar rollups across the recorded history.
Smooth or stutter
A distribution of buffering events — a long tail toward high buffering means trouble.
Fix the noisy few
The channels with the worst experience, surfaced so you can prioritize them.
Per-view timeline
Every recorded session; select a row for its full timeline. Toggle Sessions ↔ User Metrics to analyze by event or by person.
Live CPU & memory on the Dashboard
The admin Dashboard pushes live system-performance stats over a WebSocket, alongside the stat cards (Playlists, Channels, Channels live/down, EPG sources, Unmatched) and the Activity panel (live Active Sessions + recent History). Glance at Channels live vs down to spot a source problem, and Unmatched to know when to head to Channel Mapping. The Playlists and EPG Sources panels beneath list alphabetically, so a name stays where you last saw it as the install grows.
Memory pressure — the one tile whose colour is the reading
The performance strip carries six tiles: CPU, Memory, Memory pressure, Disk I/O, Network, DB connections. Memory pressure is the only visibility you have into the Rust sidecar's RAM — Node's own memory figure is the Node process and can never see the origin rings. Its big number is the total ring bytes across every channel, and the colour is the verdict: green below 15% of the box's total memory, amber at 15%, red at 30%. That 30% mark is sized against a real case — roughly 50 origins at the 25 MiB default is about 1.2 GiB, which is where a 4 GB Pi starts to hurt.
| The tile reads | Means | What to do |
|---|---|---|
| 0 B · no active origins | The sidecar is alive and no channel is currently ringing. | Nothing. This is the resting state once the last ingest closes. |
| — · not available | Nothing has ever reported, or a frame that did report live origins has been silent for 15 s (six missed reports). | On a default install this is normal — origin mode is off. Mid-stream, it means the sidecar went quiet: check the proxy logs. |
| green · N origins · <15% | Rings are held and comfortably inside the box. | Nothing. |
| amber ≥ 15% · red ≥ 30% | The sum of every channel's ring is a real share of the machine. There is no global ceiling — originRingMb bounds one channel only. | Lower originRingMb, or run fewer channels as origins. Note an ingest holds its RAM for 30 s after its last viewer leaves, so pressure can be high with an empty Active Streams screen. |
“Not available” and “no active origins” look similar and mean opposite things. The tile is deliberately grey when it has no reading, so unknown can never be mistaken for healthy. A green 0 B means the engine answered and is quiet; a grey — means nobody answered.
MongoDB-backed application logs
Every [tag] msg the server logs is persisted to the Log model (14-day TTL) via an injected sink, and fanned out to a live "View logs" drawer (/api/logs REST + /api/logs-stream WebSocket, admin-only). A tag→category map derives one of 14 categories, at three levels — info · warn · error.
proxy holds the Rust data-plane's full resolve→fetch→rewrite→serve lineage, ingested over the log seam (POST /api/internal/log) — persisted without a console re-print, since the sidecar already printed to its inherited stdout. failover is the newest, and the other one written from both planes: Node records group saves, EPG cascades, auto-disbands and exhausted chains (naming the parent and its playlist); Rust records the walk itself (carrying the session id). See Playlist Failover. The single logLevel (1|2|3) knob on Settings gates verbosity for every subsystem, Node and Rust alike, live with no restart.
| Log level | You get | Use it when |
|---|---|---|
| 1 — lifecycle + issues | Warnings and errors only. These are never gated: whatever the level, a real problem is written. | A quiet, steady install. Nothing you need is lost — only the narration. |
| 2 — and milestones | Plus the checkpoints: a sync started and finished, a stream established, a group was walked. | The default. Enough to reconstruct what happened without reading every hop. |
| 3 — and full lineage | Plus every step: each resolve hop, each poll, each ring push and evict. | Diagnosing one channel. Verbose enough that you want to turn it back down afterwards. |
There are still 14 categories. iop (input operation — resolve, poll, fetch, decrypt, ring push/evict) and oop (output operation — manifest render, segment serve, TS concat) are tags that both resolve to proxy. The split is attribution within the engine, not a new bucket: once one ingest feeds many viewers, “the channel is stuttering” has two possible causes, and the tag says which side to look at. Filter to proxy as before, then read the tag.
Keep the catalog fresh, automatically
A croner-backed runtime scheduler runs the persisted cronjobs collection. Enabled jobs register at boot; a PUT/DELETE on /api/cronjobs re-registers or unschedules immediately. Each tick dispatches on its targetType.
| targetType | What the tick does |
|---|---|
| epg-source | EPG re-sync |
| playlist | Playlist source live-sync |
| playlist-m3u | Playlist M3U (+ XMLTV guide sibling) recompose |
| backup | Scheduled on-disk backup |
| channel-probe | The Rust-assisted channel health sweep |
Three tabs, and what lives on each
Settings is split into General, Video Config and Advanced. Knowing which is which saves a hunt — in particular, the video engine's (Default) config is on Video Config, not Advanced.
The install itself
Domain — the load-bearing one, woven into every published playlist URL — plus the global log level, outbound DNS nameservers, and backup / restore / maintenance.
How video is served and watched
The Video Proxy Engine (Default) panel — every knob on the tuning table, including Local origin, Ring size and Smooth ad transitions — and the Video player choice below.
Per-provider and workspace-wide
DaddyLive Player Source (the default provider for dlhd channels), Geolocation, the dulo login capture panel, and the Custom Tags registry.
The Video player choice
Settings → Video Config → Video player decides what the channel slide-out gives you. It has three positions:
| Player | What the channel drawer shows | Best for |
|---|---|---|
| In-app video player (default) | An embedded player plus a live bitrate chart, inline in the drawer. | Glancing at a channel while you work — checking it plays at all. |
| Ultimate video player | Those two are replaced by a single Launch Ultimate Video Player button that opens a dedicated player window. | Actually watching a channel rather than glancing at it. |
| Debug video player | A diagnostic player with a live HLS status readout and an event log. | Troubleshooting a playback problem on one channel. |
The Ultimate window is a full-size picture with the launching playlist's channel list pulled out from the right edge and a what's on now / next strip under the video. Keyboard: F full screen, M mute, C channels. Your volume and mute choice are remembered between channels and windows.
Allow pop-ups for this site, or the window can't open. A blocked launch reports “Pop-up blocked — allow pop-ups for this site to open the Ultimate Video Player.”
Browsers block audio until you interact with the page. When that happens the picture says so, and one click on the banner — or the M key — turns sound on. The window opens without a tab strip, toolbar or bookmarks bar, but the thin strip showing the site address is forced on by the browser itself and cannot be turned off from the app; use Full screen for a completely bare window.
It requests streams without a playlist qualifier, exactly as the in-app player does — so it resolves against the (Default) proxy config every time. Enabling local origin on one playlist's Custom override does not change what you see in the Ultimate player; only the Default does.
One-click snapshots of the whole system
Full-system gzip
A gzipped snapshot of every collection — downloaded, or written to a configured backup directory on a schedule.
In-place re-orchestration
Restore from an uploaded backup or a saved file; the restore re-orchestrates the dependent subsystems (boot init, DNS, scheduler) in place.
Indexes & reset
From Settings: rebuild MongoDB indexes, or reset the workspace (wipe content, keep users / settings).
Domain (Settings) is built into every published playlist URL — changing it cascades and rewrites the URL of every playlist. Set it to your real public address once; any links users already saved point at the old address until they re-copy the updated URLs. Outbound-fetch DNS nameservers and the global logLevel also live in Settings.